

Before delving into the world of technical indicators, let’s understand their significance and how they can empower traders and investors. Technical analysis involves examining historical price and volume data to predict future price movements. Technical indicators, as the name suggests, are mathematical calculations based on this data. They help traders identify potential trends, reversals, and entry/exit points.
What Are Technical Indicators?
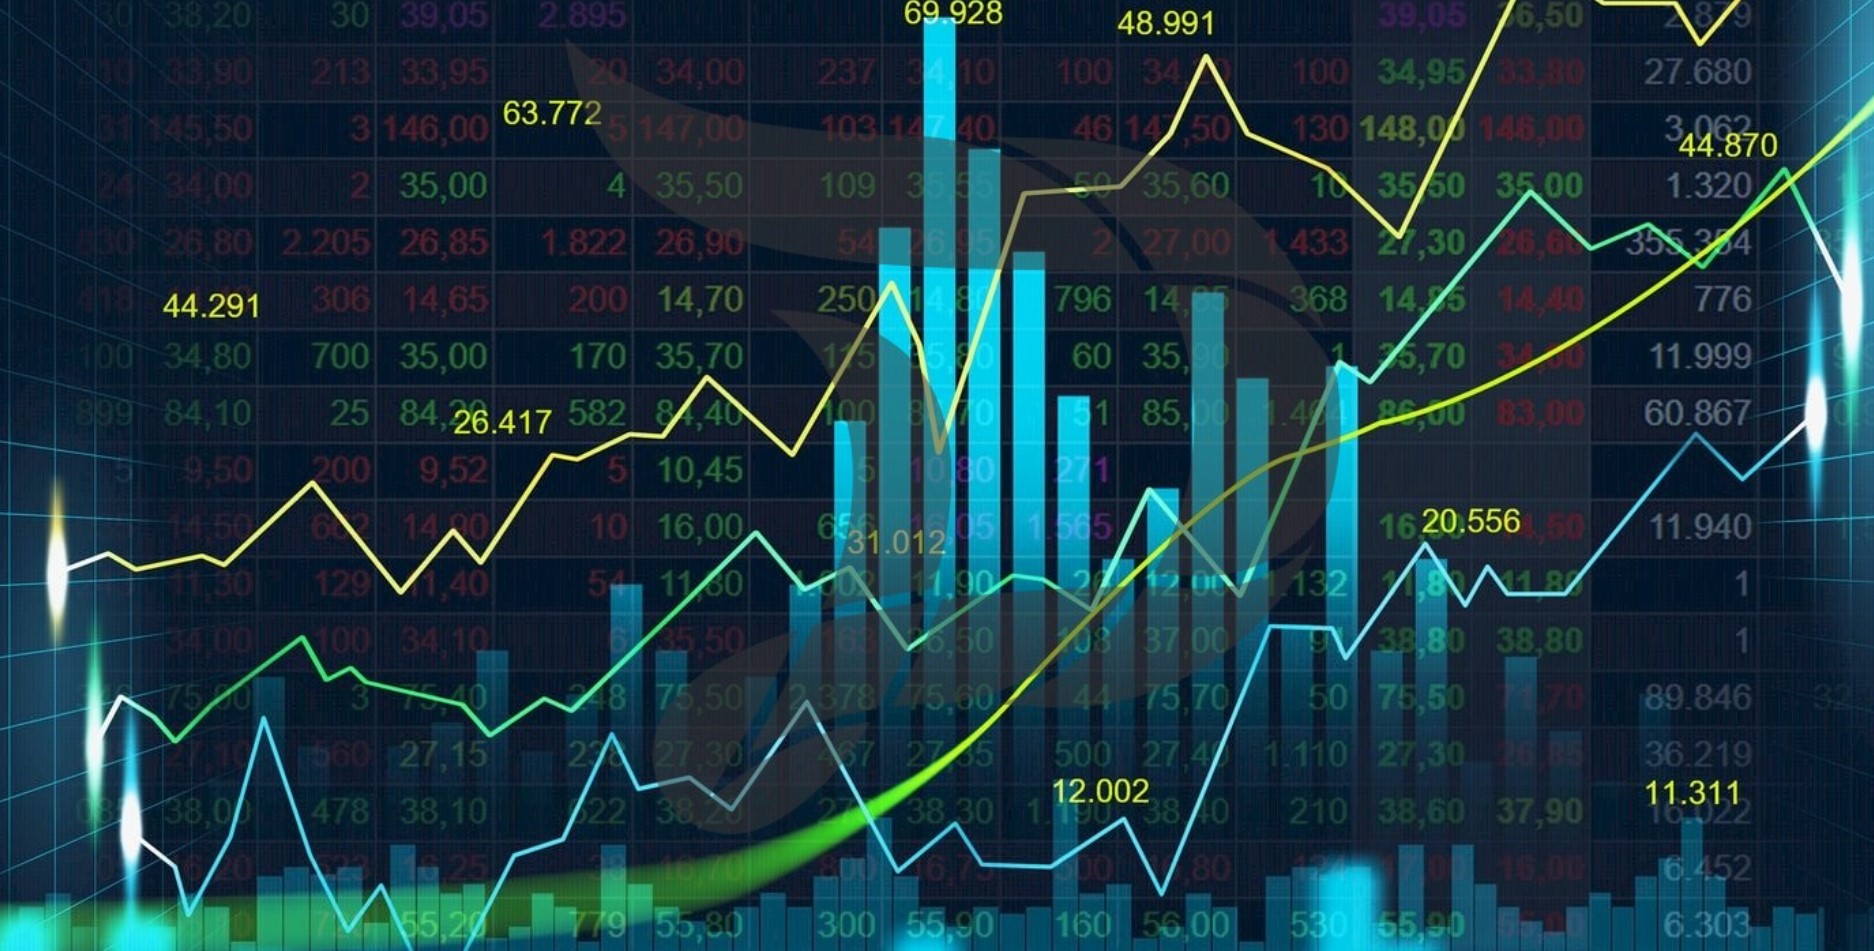
Technical indicators are tools used in technical analysis to simplify and visualize complex market data. These indicators transform raw price and volume information into easily interpretable charts and graphs. Traders use them to spot patterns, confirm trends, and make informed decisions.
Why Are Technical Indicators Important?
Technical indicators offer several advantages. They provide a structured framework for analyzing data, making it easier to spot opportunities and mitigate risks. These tools are especially valuable in volatile markets, where quick decisions are crucial.
|
Advantage |
Explanation |
|
Structured Framework |
Technical indicators offer a structured approach to analyzing market data, allowing for systematic decision-making. |
|
Enhanced Opportunity Identification |
They assist in identifying trading opportunities by highlighting potential trends and price movements. |
|
Risk Mitigation |
Technical indicators help in assessing and mitigating risks associated with various market conditions. |
|
Valuable in Volatile Markets |
These tools are particularly beneficial in volatile markets, where rapid changes in prices require quick decision-making. |
Technical indicators play a pivotal role in providing traders and investors with valuable insights, enabling them to navigate the complexities of financial markets effectively.
Types of Technical Indicators
There are various categories of technical indicators, each designed to serve a specific purpose and provide valuable insights to traders. Here’s a breakdown of these types of technical indicators:
- Moving Averages: Moving averages are fundamental tools in technical analysis. They work by smoothing out price data over a specified time period, making it easier for traders to identify trends. Two common types of moving averages are the Simple Moving Average (SMA) and the Exponential Moving Average (EMA). These indicators help traders gain a clearer perspective on the overall direction of price movements.
- Oscillators: Oscillators are indicators that oscillate or move within a specific range, often indicating overbought or oversold conditions in the market. The Relative Strength Index (RSI) and the Stochastic Oscillator are well-known examples of oscillators. Traders rely on these indicators to predict potential reversals in market trends, which can be vital for timely decision-making.
- Trend-following Indicators: Trend-following indicators are essential for traders looking to identify and confirm prevailing trends in the market. One of the most popular trend-following indicators is the Moving Average Convergence Divergence (MACD). These indicators help traders stay aligned with the trend until there are signs of a potential reversal. This is particularly valuable for traders seeking to maximize gains during prolonged trends.
- Volume Indicators: Volume indicators play a crucial role in assessing the strength of price movements by analyzing trading volume. The On-Balance Volume (OBV) and the Chaikin Money Flow (CMF) are notable examples of volume indicators. By examining trading volume, traders can gauge whether a price movement is accompanied by strong or weak market participation, aiding in decision-making.
These categories of technical indicators offer traders a diverse set of tools to analyze market data effectively. Each type serves a distinct purpose, allowing traders to tailor their analysis to specific market conditions and trading strategies.
How to Choose the Right Technical Indicators
Selecting the appropriate technical indicators requires careful consideration of various factors:
· Market Conditions
- Different indicators perform better in specific market conditions. For instance, oscillators are useful in range-bound markets, while trend-following indicators shine in trending markets.
· Trading Style
- Your trading style plays a significant role in indicator selection. Day traders may prefer shorter time frames and fast-moving indicators, while long-term investors may opt for longer time frames and slower indicators.
· Time Frame
- The time frame of your analysis impacts indicator effectiveness. Short-term traders often use hourly or daily charts, while long-term investors may rely on weekly or monthly charts.
· Asset Class
- The type of asset you’re trading also matters. Indicators suitable for stocks may not be as effective for cryptocurrencies or commodities.
· Risk Tolerance
- Consider your risk tolerance when choosing indicators. Some indicators may generate more signals, leading to more trades and potentially higher risk.
Popular Technical Indicators
Let’s explore a few popular technical indicators:
Moving Average Convergence Divergence (MACD): The MACD is a versatile indicator that serves as a dynamic duo, blending trend-following and momentum characteristics. Its utility lies in its ability to identify shifts in market trends and offer potential buy/sell signals. Traders often turn to MACD for its effectiveness in capturing changing market dynamics.
Relative Strength Index (RSI): RSI is a go-to indicator for traders looking to gauge the speed and magnitude of price movements. It plays a crucial role in identifying overbought and oversold conditions within the market. This information proves invaluable when traders seek potential trend reversals, enabling them to make well-informed decisions.
Bollinger Bands: Comprising a middle band (SMA) and two outer bands representing standard deviations, Bollinger Bands provide traders with a visual representation of price volatility. This tool helps traders identify potential breakout points and assess the market’s price movement in relation to its historical data.
Fibonacci Retracement: Fibonacci retracement levels serve as a reliable means of pinpointing possible support and resistance levels within the market. Traders frequently utilize these levels to make strategic decisions regarding their entry and exit points. The Fibonacci sequence, a mathematical concept, underpins this indicator, making it a valuable asset for traders seeking precision in their analysis.
These popular technical indicators are instrumental in empowering traders with insights into market dynamics, ultimately aiding them in making sound investment decisions.
Combining Technical Indicators
Many traders combine multiple indicators to strengthen their analysis. However, it’s essential to strike a balance and avoid overcomplicating your strategy. The goal is to complement, not overwhelm, your analysis.
The Pitfalls of Overcomplication
While technical indicators can be powerful tools, using too many at once can lead to analysis paralysis. It’s crucial to find a balance between simplicity and effectiveness in your trading strategy.
Backtesting Your Strategy
Before implementing any strategy, backtesting is vital. This involves applying your chosen indicators to historical data to assess their performance. Backtesting helps refine your strategy and identify potential flaws.
In the ever-evolving world of finance, technical indicators are invaluable tools for traders and investors. By understanding the types of indicators available, considering your specific needs and preferences, and avoiding overcomplication, you can harness the power of technical analysis to make more informed decisions in the market.
Frequently Asked Questions (FAQs)
- What is the primary purpose of technical indicators? Technical indicators simplify market data and help traders make informed decisions by identifying trends, reversals, and entry/exit points.
- How do I choose the right technical indicators for my trading style? Consider factors such as market conditions, trading style, time frame, asset class, and risk tolerance when selecting indicators.
- Can I use multiple technical indicators together? Yes, many traders combine multiple indicators, but it’s essential to strike a balance and avoid overcomplicating your strategy.
- What is the significance of backtesting a trading strategy? Backtesting involves applying your chosen indicators to historical data to assess their performance and refine your strategy.